Performance Results Report
Summary
transactions: 22891
errors: 0
run time: 320 secs
rampup: 320 secs
test start: 2011-08-23 16:44:00
test finish: 2011-08-23 16:49:19
time-series interval: 10 secs
workload configuration:
| group name | threads | script name |
|---|
| user_group-1 | 50 | example_wego2.py |
All Transactions
Transaction Response Summary (secs)
| count | min | avg | 80pct | 90pct | 95pct | max | stdev |
|---|
| 22891 | 0.041 | 0.355 | 0.528 | 0.615 | 0.688 | 12.969 | 0.268 |
Interval Details (secs)
| interval | count | rate | min | avg | 80pct | 90pct | 95pct | max | stdev |
|---|
| 1 | 35 | 3.50 | 0.398 | 0.409 | 0.413 | 0.415 | 0.416 | 0.529 | 0.021 |
| 2 | 204 | 20.40 | 0.041 | 0.141 | 0.405 | 0.425 | 0.438 | 0.692 | 0.166 |
| 3 | 472 | 47.20 | 0.042 | 0.095 | 0.067 | 0.118 | 0.447 | 0.652 | 0.124 |
| 4 | 586 | 58.60 | 0.042 | 0.103 | 0.094 | 0.119 | 0.502 | 0.728 | 0.125 |
| 5 | 652 | 65.20 | 0.042 | 0.116 | 0.116 | 0.144 | 0.512 | 0.878 | 0.127 |
| 6 | 700 | 70.00 | 0.045 | 0.131 | 0.144 | 0.171 | 0.224 | 0.889 | 0.126 |
| 7 | 711 | 71.10 | 0.045 | 0.146 | 0.160 | 0.194 | 0.273 | 0.941 | 0.131 |
| 8 | 724 | 72.40 | 0.054 | 0.174 | 0.194 | 0.245 | 0.315 | 3.129 | 0.179 |
| 9 | 742 | 74.20 | 0.061 | 0.185 | 0.209 | 0.253 | 0.314 | 1.120 | 0.134 |
| 10 | 749 | 74.90 | 0.065 | 0.205 | 0.236 | 0.289 | 0.361 | 1.375 | 0.142 |
| 11 | 757 | 75.70 | 0.067 | 0.223 | 0.249 | 0.297 | 0.373 | 1.292 | 0.150 |
| 12 | 766 | 76.60 | 0.099 | 0.242 | 0.268 | 0.329 | 0.388 | 1.258 | 0.139 |
| 13 | 759 | 75.90 | 0.108 | 0.265 | 0.297 | 0.343 | 0.428 | 1.157 | 0.139 |
| 14 | 752 | 75.20 | 0.132 | 0.287 | 0.314 | 0.356 | 0.422 | 1.131 | 0.141 |
| 15 | 792 | 79.20 | 0.064 | 0.291 | 0.327 | 0.383 | 0.510 | 2.042 | 0.174 |
| 16 | 757 | 75.70 | 0.168 | 0.326 | 0.360 | 0.406 | 0.490 | 1.397 | 0.150 |
| 17 | 814 | 81.40 | 0.084 | 0.320 | 0.371 | 0.431 | 0.543 | 2.354 | 0.167 |
| 18 | 919 | 91.90 | 0.063 | 0.301 | 0.371 | 0.459 | 0.591 | 6.552 | 0.286 |
| 19 | 795 | 79.50 | 0.092 | 0.371 | 0.421 | 0.486 | 0.644 | 6.896 | 0.320 |
| 20 | 751 | 75.10 | 0.229 | 0.408 | 0.444 | 0.490 | 0.562 | 1.501 | 0.149 |
| 21 | 764 | 76.40 | 0.224 | 0.430 | 0.469 | 0.525 | 0.597 | 1.451 | 0.147 |
| 22 | 774 | 77.40 | 0.248 | 0.439 | 0.482 | 0.528 | 0.589 | 1.632 | 0.157 |
| 23 | 772 | 77.20 | 0.283 | 0.460 | 0.499 | 0.544 | 0.608 | 3.398 | 0.182 |
| 24 | 810 | 81.00 | 0.174 | 0.458 | 0.511 | 0.583 | 0.691 | 2.434 | 0.184 |
| 25 | 931 | 93.10 | 0.147 | 0.393 | 0.473 | 0.572 | 0.722 | 5.734 | 0.357 |
| 26 | 856 | 85.60 | 0.131 | 0.490 | 0.535 | 0.616 | 0.819 | 12.969 | 0.603 |
| 27 | 771 | 77.10 | 0.335 | 0.547 | 0.590 | 0.649 | 0.718 | 1.722 | 0.155 |
| 28 | 745 | 74.50 | 0.396 | 0.578 | 0.617 | 0.659 | 0.749 | 1.540 | 0.149 |
| 29 | 757 | 75.70 | 0.393 | 0.592 | 0.633 | 0.677 | 0.753 | 1.682 | 0.159 |
| 30 | 766 | 76.60 | 0.407 | 0.607 | 0.644 | 0.707 | 0.796 | 1.688 | 0.158 |
| 31 | 756 | 75.60 | 0.466 | 0.637 | 0.676 | 0.722 | 0.809 | 1.481 | 0.146 |
| 32 | 702 | 70.20 | 0.446 | 0.664 | 0.688 | 0.724 | 0.806 | 1.485 | 0.139 |
Graphs
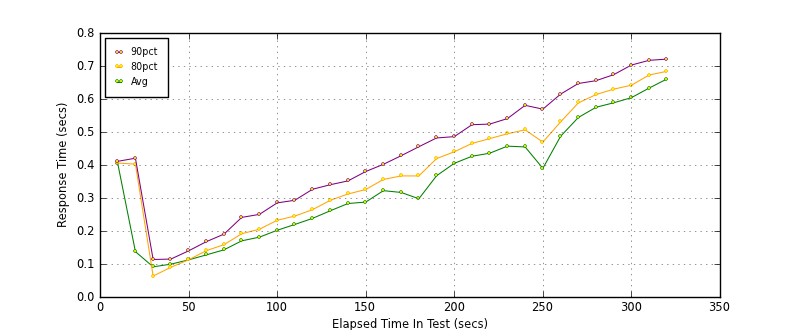
Response Time: 10 sec time-series

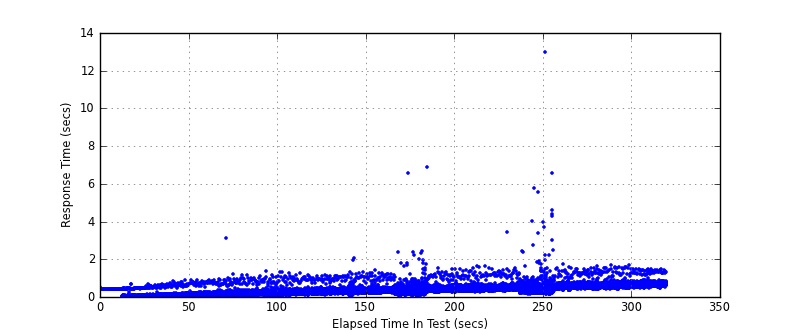
Response Time: raw data (all points)

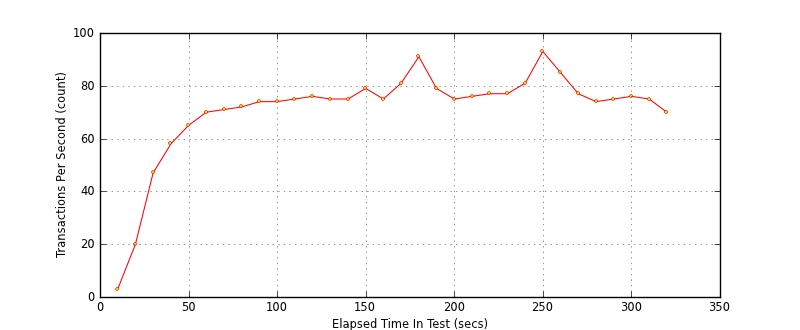
Throughput: 5 sec time-series
Custom Timer: METEOGRAM_1
Timer Summary (secs)
| count | min | avg | 80pct | 90pct | 95pct | max | stdev |
|---|
| 22841 | 0.040 | 0.352 | 0.525 | 0.612 | 0.684 | 12.965 | 0.268 |
Interval Details (secs)
| interval | count | rate | min | avg | 80pct | 90pct | 95pct | max | stdev |
|---|
| 1 | 35 | 3.50 | 0.394 | 0.405 | 0.406 | 0.411 | 0.412 | 0.522 | 0.021 |
| 2 | 204 | 20.40 | 0.040 | 0.137 | 0.403 | 0.421 | 0.434 | 0.688 | 0.165 |
| 3 | 472 | 47.20 | 0.040 | 0.091 | 0.064 | 0.114 | 0.443 | 0.648 | 0.124 |
| 4 | 586 | 58.60 | 0.041 | 0.099 | 0.090 | 0.115 | 0.499 | 0.726 | 0.125 |
| 5 | 652 | 65.20 | 0.041 | 0.112 | 0.113 | 0.140 | 0.511 | 0.874 | 0.127 |
| 6 | 700 | 70.00 | 0.043 | 0.128 | 0.140 | 0.168 | 0.222 | 0.886 | 0.126 |
| 7 | 711 | 71.10 | 0.043 | 0.143 | 0.159 | 0.191 | 0.270 | 0.940 | 0.131 |
| 8 | 724 | 72.40 | 0.050 | 0.170 | 0.192 | 0.241 | 0.308 | 3.127 | 0.179 |
| 9 | 742 | 74.20 | 0.057 | 0.181 | 0.205 | 0.250 | 0.310 | 1.117 | 0.134 |
| 10 | 749 | 74.90 | 0.060 | 0.202 | 0.232 | 0.285 | 0.357 | 1.373 | 0.142 |
| 11 | 757 | 75.70 | 0.065 | 0.220 | 0.245 | 0.293 | 0.369 | 1.291 | 0.149 |
| 12 | 766 | 76.60 | 0.095 | 0.238 | 0.265 | 0.327 | 0.384 | 1.255 | 0.139 |
| 13 | 759 | 75.90 | 0.103 | 0.261 | 0.293 | 0.340 | 0.424 | 1.154 | 0.139 |
| 14 | 752 | 75.20 | 0.128 | 0.283 | 0.312 | 0.352 | 0.418 | 1.127 | 0.141 |
| 15 | 792 | 79.20 | 0.063 | 0.288 | 0.326 | 0.380 | 0.508 | 2.038 | 0.174 |
| 16 | 757 | 75.70 | 0.164 | 0.322 | 0.356 | 0.402 | 0.486 | 1.394 | 0.150 |
| 17 | 814 | 81.40 | 0.081 | 0.317 | 0.367 | 0.428 | 0.539 | 2.353 | 0.167 |
| 18 | 919 | 91.90 | 0.059 | 0.298 | 0.367 | 0.455 | 0.589 | 6.549 | 0.286 |
| 19 | 795 | 79.50 | 0.088 | 0.367 | 0.419 | 0.482 | 0.640 | 6.893 | 0.320 |
| 20 | 751 | 75.10 | 0.225 | 0.405 | 0.440 | 0.486 | 0.559 | 1.497 | 0.149 |
| 21 | 764 | 76.40 | 0.220 | 0.427 | 0.465 | 0.522 | 0.594 | 1.447 | 0.147 |
| 22 | 774 | 77.40 | 0.244 | 0.436 | 0.480 | 0.524 | 0.588 | 1.630 | 0.157 |
| 23 | 772 | 77.20 | 0.278 | 0.457 | 0.495 | 0.541 | 0.604 | 3.396 | 0.183 |
| 24 | 810 | 81.00 | 0.173 | 0.455 | 0.507 | 0.581 | 0.689 | 2.430 | 0.184 |
| 25 | 931 | 93.10 | 0.143 | 0.390 | 0.469 | 0.569 | 0.718 | 5.730 | 0.357 |
| 26 | 856 | 85.60 | 0.127 | 0.487 | 0.530 | 0.615 | 0.816 | 12.965 | 0.603 |
| 27 | 771 | 77.10 | 0.331 | 0.544 | 0.588 | 0.647 | 0.717 | 1.715 | 0.155 |
| 28 | 745 | 74.50 | 0.391 | 0.575 | 0.613 | 0.656 | 0.745 | 1.536 | 0.149 |
| 29 | 757 | 75.70 | 0.389 | 0.588 | 0.630 | 0.674 | 0.749 | 1.677 | 0.160 |
| 30 | 766 | 76.60 | 0.402 | 0.604 | 0.642 | 0.703 | 0.792 | 1.685 | 0.158 |
| 31 | 756 | 75.60 | 0.462 | 0.633 | 0.673 | 0.717 | 0.805 | 1.479 | 0.146 |
| 32 | 702 | 70.20 | 0.445 | 0.661 | 0.684 | 0.721 | 0.803 | 1.484 | 0.139 |
Graphs
Response Time: 10 sec time-series
Response Time: raw data (all points)
Throughput: 10 sec time-series
