Performance Results Report
Summary
transactions: 5593
errors: 0
run time: 60 secs
rampup: 60 secs
test start: 2011-08-23 16:52:31
test finish: 2011-08-23 16:53:31
time-series interval: 10 secs
workload configuration:
| group name | threads | script name |
|---|
| user_group-1 | 500 | example_wego2.py |
All Transactions
Transaction Response Summary (secs)
| count | min | avg | 80pct | 90pct | 95pct | max | stdev |
|---|
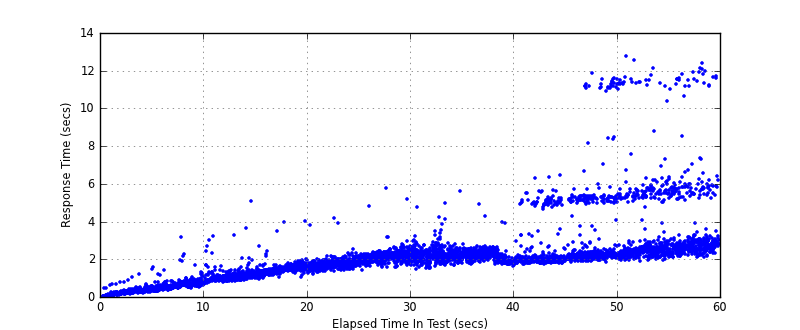
| 5593 | 0.044 | 2.115 | 2.434 | 2.965 | 5.320 | 12.746 | 1.656 |
Interval Details (secs)
| interval | count | rate | min | avg | 80pct | 90pct | 95pct | max | stdev |
|---|
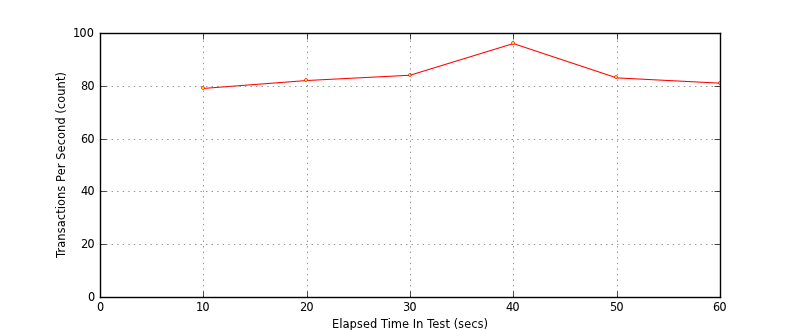
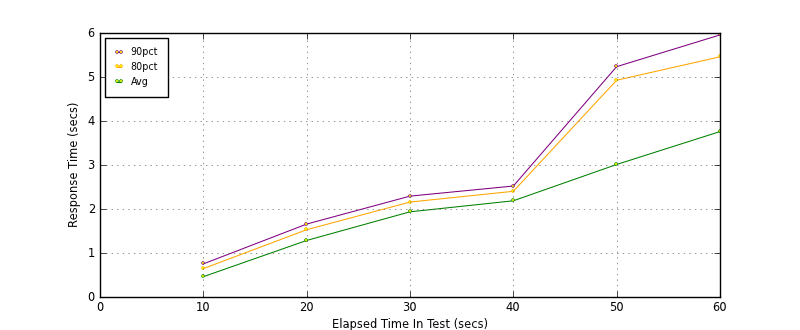
| 1 | 799 | 79.90 | 0.044 | 0.462 | 0.645 | 0.753 | 0.833 | 3.169 | 0.290 |
| 2 | 828 | 82.80 | 0.733 | 1.285 | 1.529 | 1.657 | 1.733 | 5.054 | 0.377 |
| 3 | 847 | 84.70 | 1.196 | 1.936 | 2.158 | 2.293 | 2.422 | 5.759 | 0.368 |
| 4 | 968 | 96.80 | 1.484 | 2.187 | 2.402 | 2.522 | 2.663 | 5.601 | 0.367 |
| 5 | 838 | 83.80 | 1.723 | 3.012 | 4.927 | 5.236 | 5.704 | 11.852 | 2.005 |
| 6 | 813 | 81.30 | 1.880 | 3.760 | 5.458 | 5.956 | 11.186 | 12.746 | 2.357 |
Graphs
Response Time: 10 sec time-series
Response Time: raw data (all points)
Throughput: 5 sec time-series

Custom Timer: METEOGRAM_1
Timer Summary (secs)
| count | min | avg | 80pct | 90pct | 95pct | max | stdev |
|---|
| 5093 | 0.042 | 2.110 | 2.429 | 2.963 | 5.316 | 12.745 | 1.656 |
Interval Details (secs)
| interval | count | rate | min | avg | 80pct | 90pct | 95pct | max | stdev |
|---|
| 1 | 799 | 79.90 | 0.042 | 0.458 | 0.643 | 0.750 | 0.829 | 3.164 | 0.290 |
| 2 | 828 | 82.80 | 0.730 | 1.281 | 1.525 | 1.652 | 1.729 | 5.051 | 0.377 |
| 3 | 847 | 84.70 | 1.192 | 1.931 | 2.153 | 2.290 | 2.418 | 5.756 | 0.368 |
| 4 | 968 | 96.80 | 1.480 | 2.182 | 2.399 | 2.518 | 2.659 | 5.597 | 0.368 |
| 5 | 838 | 83.80 | 1.719 | 3.008 | 4.926 | 5.232 | 5.700 | 11.849 | 2.006 |
| 6 | 813 | 81.30 | 1.877 | 3.755 | 5.450 | 5.950 | 11.182 | 12.745 | 2.357 |
Graphs
Response Time: 10 sec time-series

Response Time: raw data (all points)

Throughput: 10 sec time-series