Performance Results Report
Summary
transactions: 5196
errors: 0
run time: 60 secs
rampup: 60 secs
test start: 2011-08-23 17:02:41
test finish: 2011-08-23 17:03:40
time-series interval: 10 secs
workload configuration:
| group name | threads | script name |
|---|
| user_group-1 | 500 | example_wego2.py |
All Transactions
Transaction Response Summary (secs)
| count | min | avg | 80pct | 90pct | 95pct | max | stdev |
|---|
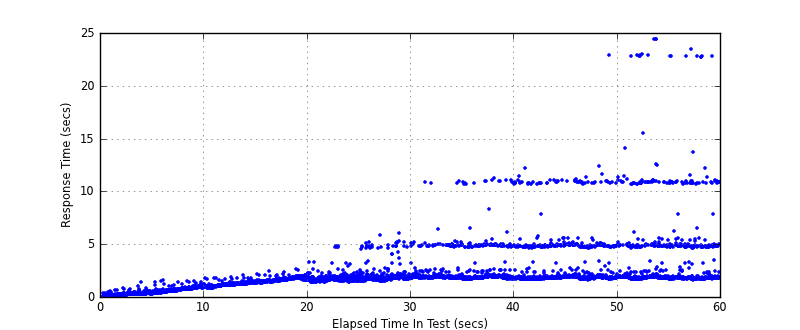
| 5196 | 0.044 | 2.273 | 2.014 | 4.797 | 5.095 | 24.422 | 2.448 |
Interval Details (secs)
| interval | count | rate | min | avg | 80pct | 90pct | 95pct | max | stdev |
|---|
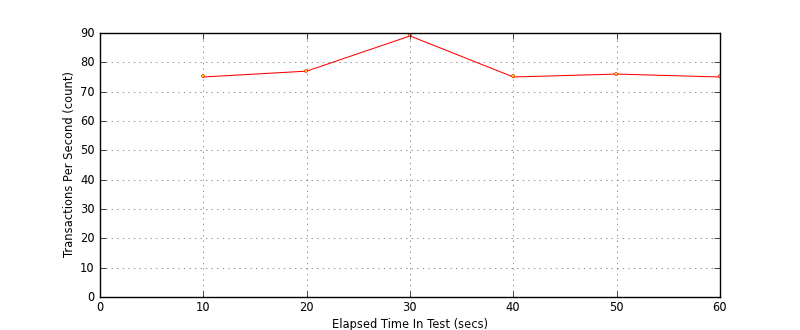
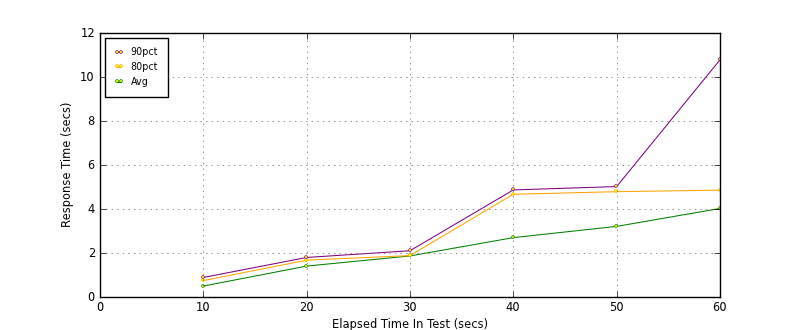
| 1 | 755 | 75.50 | 0.044 | 0.500 | 0.749 | 0.890 | 0.965 | 1.718 | 0.290 |
| 2 | 772 | 77.20 | 0.799 | 1.409 | 1.678 | 1.802 | 1.887 | 2.562 | 0.302 |
| 3 | 897 | 89.70 | 1.387 | 1.870 | 1.886 | 2.106 | 3.199 | 5.989 | 0.694 |
| 4 | 752 | 75.20 | 1.615 | 2.702 | 4.674 | 4.877 | 5.029 | 11.230 | 1.926 |
| 5 | 764 | 76.40 | 1.612 | 3.213 | 4.791 | 5.021 | 10.785 | 22.848 | 2.596 |
| 6 | 756 | 75.60 | 1.612 | 4.028 | 4.861 | 10.785 | 10.959 | 24.422 | 4.214 |
Graphs
Response Time: 10 sec time-series

Response Time: raw data (all points)

Throughput: 5 sec time-series
Custom Timer: METEOGRAM_1
Timer Summary (secs)
| count | min | avg | 80pct | 90pct | 95pct | max | stdev |
|---|
| 4696 | 0.042 | 2.270 | 2.010 | 4.793 | 5.091 | 24.418 | 2.448 |
Interval Details (secs)
| interval | count | rate | min | avg | 80pct | 90pct | 95pct | max | stdev |
|---|
| 1 | 755 | 75.50 | 0.042 | 0.497 | 0.746 | 0.888 | 0.962 | 1.717 | 0.290 |
| 2 | 772 | 77.20 | 0.795 | 1.405 | 1.675 | 1.798 | 1.886 | 2.561 | 0.302 |
| 3 | 897 | 89.70 | 1.383 | 1.866 | 1.882 | 2.103 | 3.195 | 5.985 | 0.694 |
| 4 | 752 | 75.20 | 1.611 | 2.699 | 4.670 | 4.868 | 5.025 | 11.226 | 1.926 |
| 5 | 764 | 76.40 | 1.608 | 3.210 | 4.787 | 5.020 | 10.782 | 22.847 | 2.596 |
| 6 | 756 | 75.60 | 1.608 | 4.024 | 4.857 | 10.781 | 10.955 | 24.418 | 4.214 |
Graphs
Response Time: 10 sec time-series
Response Time: raw data (all points)
Throughput: 10 sec time-series
