Performance Results Report
Summary
transactions: 22577
errors: 0
run time: 320 secs
rampup: 320 secs
test start: 2011-08-23 17:05:58
test finish: 2011-08-23 17:11:18
time-series interval: 10 secs
workload configuration:
| group name | threads | script name |
|---|
| user_group-1 | 50 | example_wego2.py |
All Transactions
Transaction Response Summary (secs)
| count | min | avg | 80pct | 90pct | 95pct | max | stdev |
|---|
| 22577 | 0.041 | 0.360 | 0.535 | 0.610 | 0.684 | 4.435 | 0.221 |
Interval Details (secs)
| interval | count | rate | min | avg | 80pct | 90pct | 95pct | max | stdev |
|---|
| 1 | 41 | 4.10 | 0.338 | 0.346 | 0.350 | 0.355 | 0.357 | 0.363 | 0.006 |
| 2 | 209 | 20.90 | 0.041 | 0.135 | 0.352 | 0.362 | 0.369 | 0.379 | 0.139 |
| 3 | 471 | 47.10 | 0.042 | 0.095 | 0.071 | 0.369 | 0.385 | 0.549 | 0.111 |
| 4 | 597 | 59.70 | 0.041 | 0.100 | 0.094 | 0.118 | 0.462 | 0.592 | 0.112 |
| 5 | 651 | 65.10 | 0.042 | 0.115 | 0.118 | 0.149 | 0.475 | 0.690 | 0.116 |
| 6 | 699 | 69.90 | 0.045 | 0.131 | 0.140 | 0.175 | 0.454 | 0.892 | 0.121 |
| 7 | 717 | 71.70 | 0.047 | 0.147 | 0.160 | 0.208 | 0.297 | 0.872 | 0.129 |
| 8 | 735 | 73.50 | 0.052 | 0.167 | 0.194 | 0.238 | 0.313 | 0.989 | 0.126 |
| 9 | 738 | 73.80 | 0.050 | 0.186 | 0.219 | 0.268 | 0.348 | 0.985 | 0.125 |
| 10 | 760 | 76.00 | 0.060 | 0.205 | 0.236 | 0.288 | 0.368 | 1.064 | 0.131 |
| 11 | 751 | 75.10 | 0.068 | 0.223 | 0.255 | 0.312 | 0.406 | 1.199 | 0.132 |
| 12 | 751 | 75.10 | 0.071 | 0.245 | 0.276 | 0.317 | 0.397 | 1.241 | 0.132 |
| 13 | 757 | 75.70 | 0.113 | 0.263 | 0.298 | 0.353 | 0.412 | 1.050 | 0.128 |
| 14 | 800 | 80.00 | 0.073 | 0.270 | 0.311 | 0.387 | 0.477 | 1.400 | 0.155 |
| 15 | 775 | 77.50 | 0.142 | 0.298 | 0.330 | 0.385 | 0.459 | 1.082 | 0.128 |
| 16 | 752 | 75.20 | 0.183 | 0.328 | 0.354 | 0.400 | 0.455 | 1.168 | 0.132 |
| 17 | 749 | 74.90 | 0.203 | 0.350 | 0.381 | 0.437 | 0.494 | 1.191 | 0.129 |
| 18 | 775 | 77.50 | 0.172 | 0.360 | 0.397 | 0.454 | 0.545 | 1.249 | 0.139 |
| 19 | 761 | 76.10 | 0.131 | 0.385 | 0.424 | 0.470 | 0.577 | 1.536 | 0.141 |
| 20 | 849 | 84.90 | 0.099 | 0.360 | 0.419 | 0.500 | 0.610 | 4.435 | 0.278 |
| 21 | 749 | 74.90 | 0.268 | 0.436 | 0.475 | 0.526 | 0.614 | 1.349 | 0.131 |
| 22 | 742 | 74.20 | 0.277 | 0.455 | 0.487 | 0.543 | 0.615 | 1.285 | 0.136 |
| 23 | 740 | 74.00 | 0.322 | 0.482 | 0.524 | 0.586 | 0.663 | 1.409 | 0.138 |
| 24 | 755 | 75.50 | 0.333 | 0.490 | 0.526 | 0.575 | 0.653 | 1.325 | 0.133 |
| 25 | 767 | 76.70 | 0.316 | 0.504 | 0.550 | 0.599 | 0.683 | 1.412 | 0.140 |
| 26 | 883 | 88.30 | 0.199 | 0.455 | 0.537 | 0.610 | 0.744 | 2.724 | 0.200 |
| 27 | 762 | 76.20 | 0.171 | 0.551 | 0.599 | 0.650 | 0.782 | 1.939 | 0.175 |
| 28 | 745 | 74.50 | 0.392 | 0.579 | 0.618 | 0.667 | 0.770 | 1.408 | 0.133 |
| 29 | 785 | 78.50 | 0.376 | 0.571 | 0.611 | 0.658 | 0.737 | 1.576 | 0.141 |
| 30 | 761 | 76.10 | 0.406 | 0.611 | 0.653 | 0.705 | 0.800 | 1.560 | 0.137 |
| 31 | 767 | 76.70 | 0.440 | 0.624 | 0.662 | 0.719 | 0.796 | 1.588 | 0.136 |
| 32 | 733 | 73.30 | 0.464 | 0.650 | 0.692 | 0.744 | 0.837 | 1.650 | 0.140 |
Graphs
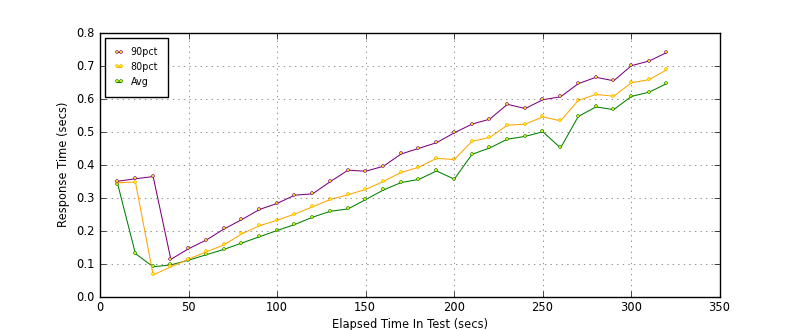
Response Time: 10 sec time-series

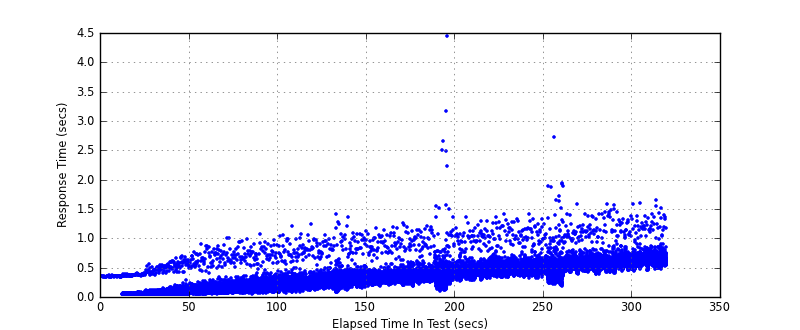
Response Time: raw data (all points)
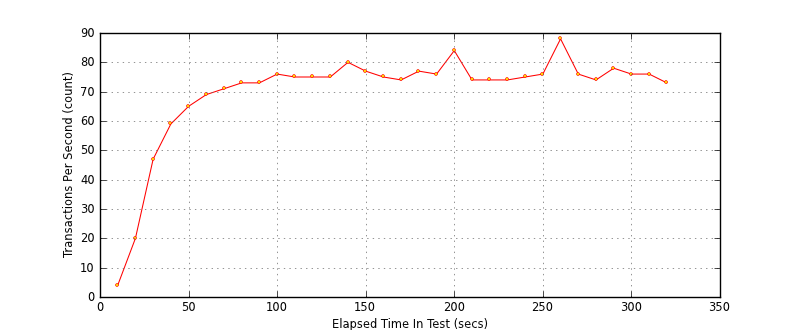
Throughput: 5 sec time-series

Custom Timer: METEOGRAM_1
Timer Summary (secs)
| count | min | avg | 80pct | 90pct | 95pct | max | stdev |
|---|
| 22527 | 0.040 | 0.357 | 0.531 | 0.607 | 0.681 | 4.431 | 0.221 |
Interval Details (secs)
| interval | count | rate | min | avg | 80pct | 90pct | 95pct | max | stdev |
|---|
| 1 | 41 | 4.10 | 0.336 | 0.342 | 0.346 | 0.351 | 0.352 | 0.357 | 0.006 |
| 2 | 209 | 20.90 | 0.040 | 0.131 | 0.348 | 0.358 | 0.363 | 0.373 | 0.139 |
| 3 | 471 | 47.10 | 0.041 | 0.092 | 0.067 | 0.365 | 0.381 | 0.545 | 0.111 |
| 4 | 597 | 59.70 | 0.040 | 0.097 | 0.091 | 0.114 | 0.458 | 0.590 | 0.112 |
| 5 | 651 | 65.10 | 0.041 | 0.112 | 0.115 | 0.146 | 0.474 | 0.689 | 0.116 |
| 6 | 699 | 69.90 | 0.043 | 0.128 | 0.137 | 0.173 | 0.450 | 0.888 | 0.121 |
| 7 | 717 | 71.70 | 0.041 | 0.144 | 0.158 | 0.206 | 0.296 | 0.868 | 0.129 |
| 8 | 735 | 73.50 | 0.049 | 0.163 | 0.191 | 0.234 | 0.309 | 0.988 | 0.126 |
| 9 | 738 | 73.80 | 0.048 | 0.183 | 0.216 | 0.265 | 0.343 | 0.983 | 0.125 |
| 10 | 760 | 76.00 | 0.056 | 0.202 | 0.233 | 0.284 | 0.367 | 1.060 | 0.131 |
| 11 | 751 | 75.10 | 0.066 | 0.220 | 0.251 | 0.309 | 0.404 | 1.198 | 0.132 |
| 12 | 751 | 75.10 | 0.070 | 0.242 | 0.273 | 0.313 | 0.394 | 1.239 | 0.132 |
| 13 | 757 | 75.70 | 0.112 | 0.260 | 0.296 | 0.350 | 0.409 | 1.046 | 0.128 |
| 14 | 800 | 80.00 | 0.070 | 0.267 | 0.310 | 0.384 | 0.476 | 1.399 | 0.155 |
| 15 | 775 | 77.50 | 0.140 | 0.295 | 0.326 | 0.381 | 0.456 | 1.078 | 0.128 |
| 16 | 752 | 75.20 | 0.182 | 0.324 | 0.350 | 0.396 | 0.450 | 1.163 | 0.132 |
| 17 | 749 | 74.90 | 0.199 | 0.347 | 0.378 | 0.433 | 0.490 | 1.187 | 0.129 |
| 18 | 775 | 77.50 | 0.167 | 0.356 | 0.393 | 0.451 | 0.544 | 1.245 | 0.139 |
| 19 | 761 | 76.10 | 0.127 | 0.382 | 0.420 | 0.468 | 0.574 | 1.535 | 0.142 |
| 20 | 849 | 84.90 | 0.097 | 0.357 | 0.416 | 0.497 | 0.606 | 4.431 | 0.278 |
| 21 | 749 | 74.90 | 0.264 | 0.432 | 0.472 | 0.524 | 0.613 | 1.347 | 0.131 |
| 22 | 742 | 74.20 | 0.273 | 0.452 | 0.484 | 0.539 | 0.614 | 1.283 | 0.136 |
| 23 | 740 | 74.00 | 0.320 | 0.478 | 0.521 | 0.584 | 0.659 | 1.405 | 0.138 |
| 24 | 755 | 75.50 | 0.329 | 0.487 | 0.524 | 0.571 | 0.649 | 1.321 | 0.133 |
| 25 | 767 | 76.70 | 0.312 | 0.501 | 0.546 | 0.598 | 0.680 | 1.408 | 0.140 |
| 26 | 883 | 88.30 | 0.195 | 0.452 | 0.534 | 0.607 | 0.743 | 2.720 | 0.200 |
| 27 | 762 | 76.20 | 0.167 | 0.547 | 0.596 | 0.646 | 0.778 | 1.935 | 0.175 |
| 28 | 745 | 74.50 | 0.388 | 0.576 | 0.614 | 0.666 | 0.766 | 1.404 | 0.133 |
| 29 | 785 | 78.50 | 0.372 | 0.568 | 0.608 | 0.655 | 0.733 | 1.574 | 0.141 |
| 30 | 761 | 76.10 | 0.401 | 0.608 | 0.649 | 0.701 | 0.796 | 1.558 | 0.137 |
| 31 | 767 | 76.70 | 0.436 | 0.621 | 0.659 | 0.715 | 0.794 | 1.586 | 0.136 |
| 32 | 733 | 73.30 | 0.461 | 0.647 | 0.689 | 0.741 | 0.833 | 1.646 | 0.140 |
Graphs
Response Time: 10 sec time-series
Response Time: raw data (all points)

Throughput: 10 sec time-series