Performance Results Report
Summary
transactions: 27978
errors: 0
run time: 320 secs
rampup: 60 secs
test start: 2011-08-24 09:52:45
test finish: 2011-08-24 09:58:05
time-series interval: 10 secs
workload configuration:
| group name | threads | script name |
|---|
| user_group-1 | 100 | example_wego2.py |
All Transactions
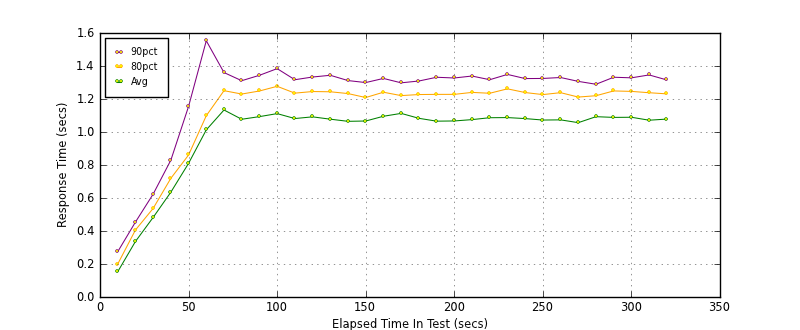
Transaction Response Summary (secs)
| count | min | avg | 80pct | 90pct | 95pct | max | stdev |
|---|
| 27978 | 0.043 | 1.000 | 1.216 | 1.313 | 1.401 | 7.773 | 0.375 |
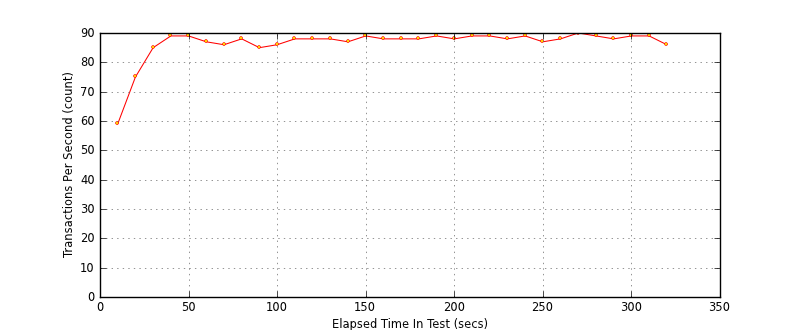
Interval Details (secs)
| interval | count | rate | min | avg | 80pct | 90pct | 95pct | max | stdev |
|---|
| 1 | 590 | 59.00 | 0.043 | 0.153 | 0.199 | 0.274 | 0.374 | 0.840 | 0.125 |
| 2 | 752 | 75.20 | 0.103 | 0.336 | 0.406 | 0.454 | 0.562 | 1.277 | 0.146 |
| 3 | 853 | 85.30 | 0.286 | 0.482 | 0.537 | 0.624 | 0.708 | 2.522 | 0.173 |
| 4 | 899 | 89.90 | 0.344 | 0.635 | 0.719 | 0.830 | 1.024 | 5.072 | 0.328 |
| 5 | 895 | 89.50 | 0.348 | 0.810 | 0.861 | 1.155 | 1.595 | 7.773 | 0.562 |
| 6 | 878 | 87.80 | 0.434 | 1.013 | 1.099 | 1.553 | 1.938 | 7.430 | 0.657 |
| 7 | 865 | 86.50 | 0.606 | 1.133 | 1.250 | 1.360 | 1.518 | 3.691 | 0.324 |
| 8 | 888 | 88.80 | 0.550 | 1.077 | 1.230 | 1.311 | 1.377 | 3.841 | 0.260 |
| 9 | 858 | 85.80 | 0.504 | 1.093 | 1.249 | 1.344 | 1.415 | 3.680 | 0.298 |
| 10 | 866 | 86.60 | 0.522 | 1.111 | 1.277 | 1.384 | 1.489 | 3.796 | 0.310 |
| 11 | 887 | 88.70 | 0.502 | 1.082 | 1.236 | 1.317 | 1.392 | 3.639 | 0.269 |
| 12 | 884 | 88.40 | 0.534 | 1.092 | 1.245 | 1.333 | 1.424 | 4.337 | 0.298 |
| 13 | 882 | 88.20 | 0.479 | 1.078 | 1.244 | 1.344 | 1.405 | 3.443 | 0.267 |
| 14 | 879 | 87.90 | 0.477 | 1.065 | 1.233 | 1.312 | 1.392 | 3.765 | 0.289 |
| 15 | 895 | 89.50 | 0.538 | 1.067 | 1.209 | 1.300 | 1.390 | 3.870 | 0.278 |
| 16 | 883 | 88.30 | 0.606 | 1.095 | 1.241 | 1.325 | 1.407 | 3.404 | 0.274 |
| 17 | 886 | 88.60 | 0.662 | 1.113 | 1.221 | 1.298 | 1.376 | 2.967 | 0.233 |
| 18 | 889 | 88.90 | 0.550 | 1.083 | 1.227 | 1.309 | 1.379 | 3.474 | 0.262 |
| 19 | 894 | 89.40 | 0.504 | 1.066 | 1.228 | 1.332 | 1.425 | 4.124 | 0.293 |
| 20 | 883 | 88.30 | 0.496 | 1.067 | 1.228 | 1.327 | 1.400 | 3.713 | 0.290 |
| 21 | 896 | 89.60 | 0.448 | 1.075 | 1.240 | 1.339 | 1.414 | 3.722 | 0.282 |
| 22 | 895 | 89.50 | 0.381 | 1.087 | 1.235 | 1.317 | 1.397 | 3.437 | 0.265 |
| 23 | 880 | 88.00 | 0.436 | 1.087 | 1.262 | 1.349 | 1.440 | 3.659 | 0.300 |
| 24 | 895 | 89.50 | 0.485 | 1.081 | 1.239 | 1.324 | 1.409 | 3.512 | 0.285 |
| 25 | 876 | 87.60 | 0.495 | 1.072 | 1.227 | 1.325 | 1.384 | 3.598 | 0.270 |
| 26 | 886 | 88.60 | 0.510 | 1.074 | 1.238 | 1.330 | 1.400 | 3.776 | 0.289 |
| 27 | 909 | 90.90 | 0.492 | 1.057 | 1.212 | 1.307 | 1.399 | 3.492 | 0.283 |
| 28 | 899 | 89.90 | 0.579 | 1.093 | 1.220 | 1.289 | 1.345 | 3.465 | 0.245 |
| 29 | 886 | 88.60 | 0.551 | 1.088 | 1.249 | 1.332 | 1.399 | 3.519 | 0.267 |
| 30 | 890 | 89.00 | 0.567 | 1.089 | 1.246 | 1.328 | 1.413 | 3.727 | 0.281 |
| 31 | 894 | 89.40 | 0.485 | 1.071 | 1.238 | 1.346 | 1.425 | 3.672 | 0.291 |
| 32 | 866 | 86.60 | 0.503 | 1.078 | 1.231 | 1.315 | 1.395 | 3.775 | 0.285 |
Graphs
Response Time: 10 sec time-series
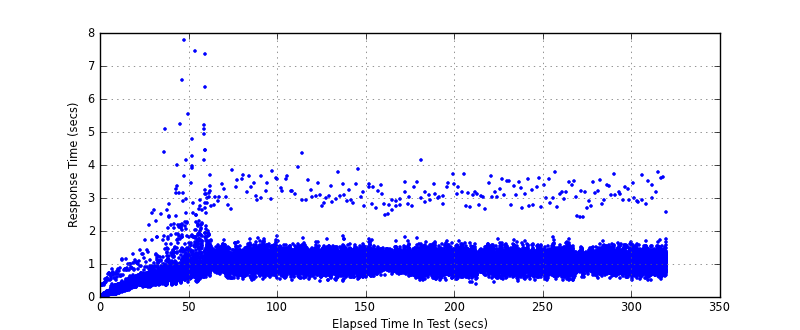
Response Time: raw data (all points)
Throughput: 5 sec time-series
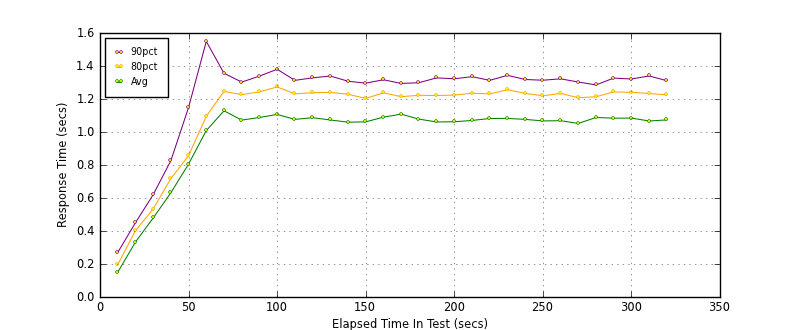
Custom Timer: METEOGRAM_1
Timer Summary (secs)
| count | min | avg | 80pct | 90pct | 95pct | max | stdev |
|---|
| 27878 | 0.041 | 0.995 | 1.211 | 1.307 | 1.397 | 7.770 | 0.375 |
Interval Details (secs)
| interval | count | rate | min | avg | 80pct | 90pct | 95pct | max | stdev |
|---|
| 1 | 590 | 59.00 | 0.041 | 0.150 | 0.196 | 0.270 | 0.371 | 0.836 | 0.125 |
| 2 | 752 | 75.20 | 0.099 | 0.333 | 0.402 | 0.450 | 0.560 | 1.272 | 0.146 |
| 3 | 853 | 85.30 | 0.282 | 0.479 | 0.533 | 0.620 | 0.704 | 2.521 | 0.173 |
| 4 | 899 | 89.90 | 0.338 | 0.632 | 0.717 | 0.826 | 1.021 | 5.068 | 0.328 |
| 5 | 895 | 89.50 | 0.344 | 0.806 | 0.857 | 1.149 | 1.592 | 7.770 | 0.562 |
| 6 | 878 | 87.80 | 0.430 | 1.009 | 1.095 | 1.549 | 1.934 | 7.425 | 0.657 |
| 7 | 865 | 86.50 | 0.603 | 1.128 | 1.247 | 1.356 | 1.512 | 3.687 | 0.324 |
| 8 | 888 | 88.80 | 0.547 | 1.072 | 1.226 | 1.302 | 1.373 | 3.837 | 0.260 |
| 9 | 858 | 85.80 | 0.499 | 1.088 | 1.243 | 1.339 | 1.411 | 3.675 | 0.298 |
| 10 | 866 | 86.60 | 0.519 | 1.107 | 1.273 | 1.380 | 1.485 | 3.790 | 0.310 |
| 11 | 887 | 88.70 | 0.498 | 1.077 | 1.231 | 1.313 | 1.388 | 3.635 | 0.269 |
| 12 | 884 | 88.40 | 0.530 | 1.087 | 1.238 | 1.328 | 1.420 | 4.319 | 0.298 |
| 13 | 882 | 88.20 | 0.475 | 1.073 | 1.240 | 1.339 | 1.401 | 3.439 | 0.267 |
| 14 | 879 | 87.90 | 0.473 | 1.060 | 1.229 | 1.308 | 1.384 | 3.764 | 0.289 |
| 15 | 895 | 89.50 | 0.534 | 1.061 | 1.204 | 1.296 | 1.385 | 3.866 | 0.277 |
| 16 | 883 | 88.30 | 0.603 | 1.090 | 1.237 | 1.317 | 1.404 | 3.400 | 0.273 |
| 17 | 886 | 88.60 | 0.658 | 1.108 | 1.214 | 1.294 | 1.372 | 2.961 | 0.233 |
| 18 | 889 | 88.90 | 0.545 | 1.078 | 1.223 | 1.299 | 1.375 | 3.470 | 0.262 |
| 19 | 894 | 89.40 | 0.500 | 1.061 | 1.221 | 1.328 | 1.422 | 4.102 | 0.293 |
| 20 | 883 | 88.30 | 0.492 | 1.062 | 1.224 | 1.323 | 1.394 | 3.709 | 0.290 |
| 21 | 896 | 89.60 | 0.444 | 1.070 | 1.235 | 1.335 | 1.410 | 3.721 | 0.282 |
| 22 | 895 | 89.50 | 0.377 | 1.082 | 1.231 | 1.313 | 1.392 | 3.433 | 0.266 |
| 23 | 880 | 88.00 | 0.432 | 1.082 | 1.256 | 1.343 | 1.436 | 3.655 | 0.300 |
| 24 | 895 | 89.50 | 0.481 | 1.077 | 1.234 | 1.318 | 1.405 | 3.508 | 0.285 |
| 25 | 876 | 87.60 | 0.491 | 1.067 | 1.219 | 1.314 | 1.380 | 3.594 | 0.269 |
| 26 | 886 | 88.60 | 0.506 | 1.069 | 1.234 | 1.322 | 1.395 | 3.773 | 0.289 |
| 27 | 909 | 90.90 | 0.488 | 1.052 | 1.208 | 1.303 | 1.395 | 3.488 | 0.283 |
| 28 | 899 | 89.90 | 0.576 | 1.088 | 1.214 | 1.285 | 1.337 | 3.461 | 0.245 |
| 29 | 886 | 88.60 | 0.547 | 1.084 | 1.243 | 1.327 | 1.394 | 3.515 | 0.267 |
| 30 | 890 | 89.00 | 0.564 | 1.085 | 1.241 | 1.321 | 1.409 | 3.723 | 0.281 |
| 31 | 894 | 89.40 | 0.481 | 1.067 | 1.233 | 1.340 | 1.421 | 3.668 | 0.291 |
| 32 | 866 | 86.60 | 0.500 | 1.073 | 1.225 | 1.311 | 1.392 | 3.771 | 0.285 |
Graphs
Response Time: 10 sec time-series
Response Time: raw data (all points)

Throughput: 10 sec time-series
