Performance Results Report
Summary
transactions: 24849
errors: 0
run time: 320 secs
rampup: 60 secs
test start: 2011-08-24 10:28:16
test finish: 2011-08-24 10:33:35
time-series interval: 10 secs
workload configuration:
| group name | threads | script name |
|---|
| user_group-1 | 150 | example_wego2.py |
All Transactions
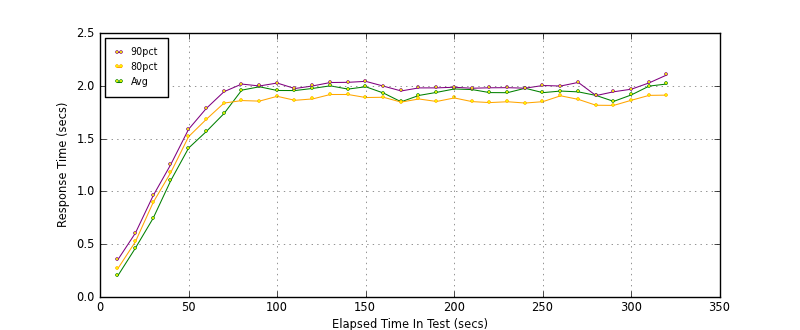
Transaction Response Summary (secs)
| count | min | avg | 80pct | 90pct | 95pct | max | stdev |
|---|
| 24849 | 0.042 | 1.751 | 1.849 | 1.953 | 2.364 | 23.357 | 0.920 |
Interval Details (secs)
| interval | count | rate | min | avg | 80pct | 90pct | 95pct | max | stdev |
|---|
| 1 | 657 | 65.70 | 0.042 | 0.200 | 0.267 | 0.351 | 0.430 | 1.026 | 0.143 |
| 2 | 802 | 80.20 | 0.252 | 0.464 | 0.524 | 0.606 | 0.723 | 2.179 | 0.166 |
| 3 | 812 | 81.20 | 0.355 | 0.746 | 0.895 | 0.959 | 1.041 | 4.928 | 0.288 |
| 4 | 759 | 75.90 | 0.886 | 1.104 | 1.180 | 1.256 | 1.331 | 1.894 | 0.151 |
| 5 | 764 | 76.40 | 1.182 | 1.410 | 1.518 | 1.588 | 1.676 | 2.332 | 0.164 |
| 6 | 857 | 85.70 | 1.211 | 1.567 | 1.682 | 1.786 | 1.915 | 3.774 | 0.245 |
| 7 | 838 | 83.80 | 1.282 | 1.737 | 1.836 | 1.944 | 2.168 | 5.660 | 0.488 |
| 8 | 758 | 75.80 | 1.591 | 1.959 | 1.860 | 2.016 | 2.713 | 10.964 | 0.793 |
| 9 | 756 | 75.60 | 1.585 | 1.991 | 1.855 | 1.998 | 2.472 | 23.357 | 1.209 |
| 10 | 760 | 76.00 | 1.558 | 1.956 | 1.900 | 2.026 | 2.634 | 5.417 | 0.646 |
| 11 | 776 | 77.60 | 1.518 | 1.955 | 1.863 | 1.974 | 2.514 | 10.884 | 0.971 |
| 12 | 763 | 76.30 | 1.553 | 1.975 | 1.876 | 1.999 | 2.609 | 11.014 | 0.949 |
| 13 | 752 | 75.20 | 1.611 | 2.000 | 1.918 | 2.031 | 2.509 | 10.843 | 0.959 |
| 14 | 743 | 74.30 | 1.599 | 1.969 | 1.918 | 2.033 | 2.453 | 10.991 | 0.810 |
| 15 | 764 | 76.40 | 1.559 | 1.991 | 1.889 | 2.042 | 4.674 | 10.994 | 1.017 |
| 16 | 762 | 76.20 | 1.615 | 1.932 | 1.891 | 1.997 | 2.407 | 10.800 | 0.699 |
| 17 | 835 | 83.50 | 1.306 | 1.848 | 1.846 | 1.951 | 2.495 | 10.787 | 0.944 |
| 18 | 777 | 77.70 | 1.393 | 1.909 | 1.875 | 1.980 | 2.401 | 22.825 | 0.987 |
| 19 | 763 | 76.30 | 1.543 | 1.938 | 1.851 | 1.980 | 2.514 | 10.869 | 0.834 |
| 20 | 764 | 76.40 | 1.596 | 1.970 | 1.885 | 1.986 | 2.452 | 22.707 | 1.125 |
| 21 | 773 | 77.30 | 1.582 | 1.964 | 1.850 | 1.977 | 2.525 | 11.302 | 0.984 |
| 22 | 770 | 77.00 | 1.545 | 1.936 | 1.841 | 1.981 | 2.502 | 10.852 | 0.822 |
| 23 | 768 | 76.80 | 1.620 | 1.935 | 1.849 | 1.982 | 2.414 | 10.881 | 0.832 |
| 24 | 771 | 77.10 | 1.571 | 1.977 | 1.837 | 1.978 | 4.677 | 22.845 | 1.144 |
| 25 | 772 | 77.20 | 1.549 | 1.935 | 1.850 | 2.003 | 2.614 | 11.398 | 0.731 |
| 26 | 772 | 77.20 | 1.559 | 1.950 | 1.905 | 1.998 | 2.663 | 11.142 | 0.767 |
| 27 | 767 | 76.70 | 1.543 | 1.943 | 1.872 | 2.032 | 2.516 | 10.838 | 0.767 |
| 28 | 785 | 78.50 | 1.518 | 1.909 | 1.816 | 1.907 | 2.469 | 11.302 | 0.880 |
| 29 | 826 | 82.60 | 1.324 | 1.853 | 1.814 | 1.943 | 2.369 | 10.858 | 0.924 |
| 30 | 770 | 77.00 | 1.556 | 1.914 | 1.863 | 1.968 | 2.478 | 10.974 | 0.700 |
| 31 | 746 | 74.60 | 1.638 | 1.997 | 1.909 | 2.028 | 2.453 | 10.859 | 0.873 |
| 32 | 717 | 71.70 | 1.664 | 2.017 | 1.912 | 2.103 | 4.718 | 10.847 | 0.870 |
Graphs
Response Time: 10 sec time-series
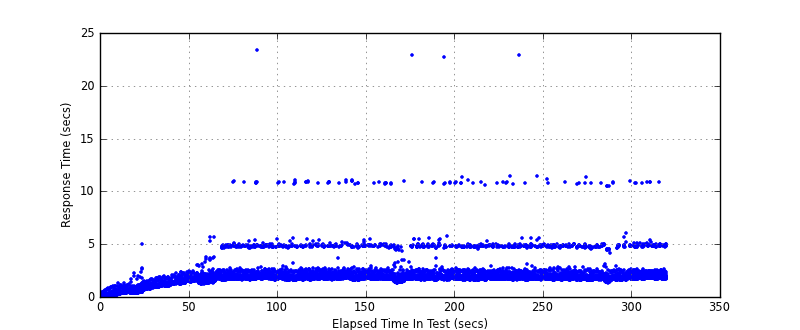
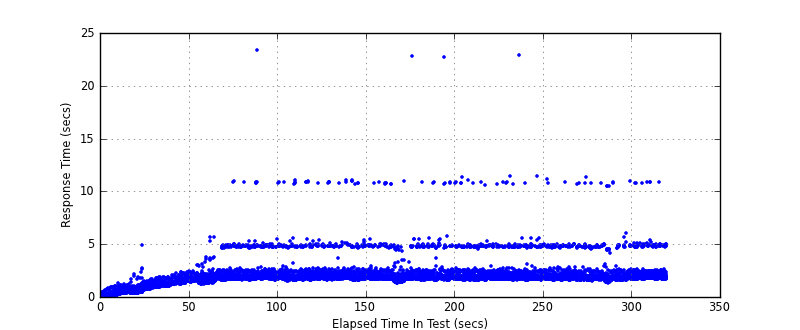
Response Time: raw data (all points)
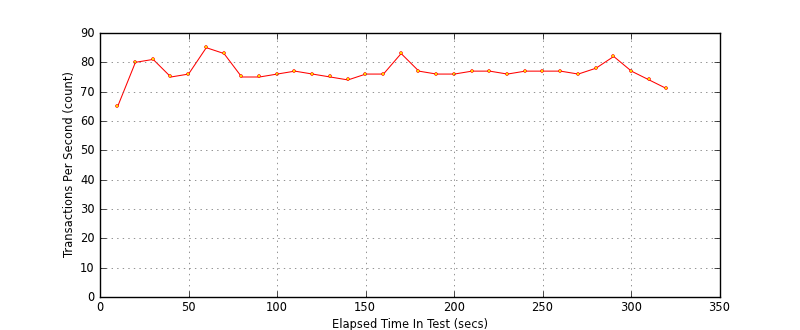
Throughput: 5 sec time-series
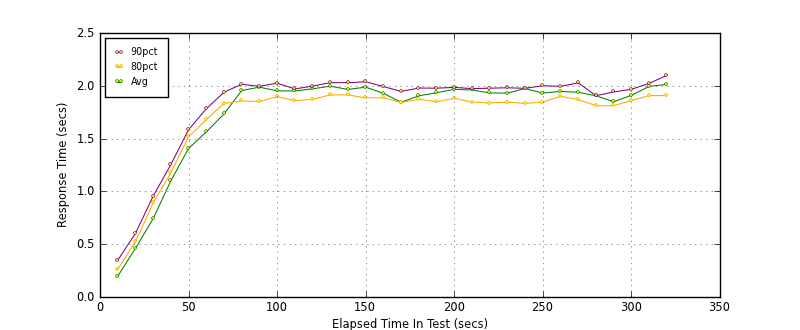
Custom Timer: METEOGRAM_1
Timer Summary (secs)
| count | min | avg | 80pct | 90pct | 95pct | max | stdev |
|---|
| 24699 | 0.041 | 1.747 | 1.845 | 1.949 | 2.360 | 23.353 | 0.920 |
Interval Details (secs)
| interval | count | rate | min | avg | 80pct | 90pct | 95pct | max | stdev |
|---|
| 1 | 657 | 65.70 | 0.041 | 0.196 | 0.263 | 0.348 | 0.429 | 1.023 | 0.143 |
| 2 | 802 | 80.20 | 0.248 | 0.460 | 0.522 | 0.602 | 0.722 | 2.177 | 0.166 |
| 3 | 812 | 81.20 | 0.351 | 0.742 | 0.891 | 0.954 | 1.037 | 4.924 | 0.288 |
| 4 | 759 | 75.90 | 0.882 | 1.101 | 1.176 | 1.254 | 1.330 | 1.891 | 0.151 |
| 5 | 764 | 76.40 | 1.177 | 1.407 | 1.516 | 1.584 | 1.675 | 2.331 | 0.164 |
| 6 | 857 | 85.70 | 1.208 | 1.563 | 1.680 | 1.782 | 1.910 | 3.771 | 0.245 |
| 7 | 838 | 83.80 | 1.278 | 1.733 | 1.833 | 1.940 | 2.164 | 5.656 | 0.488 |
| 8 | 758 | 75.80 | 1.587 | 1.955 | 1.857 | 2.015 | 2.709 | 10.960 | 0.793 |
| 9 | 756 | 75.60 | 1.581 | 1.987 | 1.852 | 1.995 | 2.468 | 23.353 | 1.209 |
| 10 | 760 | 76.00 | 1.554 | 1.952 | 1.897 | 2.025 | 2.630 | 5.416 | 0.646 |
| 11 | 776 | 77.60 | 1.502 | 1.951 | 1.860 | 1.970 | 2.510 | 10.880 | 0.971 |
| 12 | 763 | 76.30 | 1.549 | 1.971 | 1.871 | 1.997 | 2.608 | 11.010 | 0.949 |
| 13 | 752 | 75.20 | 1.607 | 1.996 | 1.914 | 2.030 | 2.506 | 10.842 | 0.959 |
| 14 | 743 | 74.30 | 1.595 | 1.966 | 1.914 | 2.029 | 2.450 | 10.990 | 0.810 |
| 15 | 764 | 76.40 | 1.555 | 1.987 | 1.886 | 2.038 | 4.673 | 10.993 | 1.017 |
| 16 | 762 | 76.20 | 1.611 | 1.928 | 1.887 | 1.992 | 2.403 | 10.796 | 0.699 |
| 17 | 835 | 83.50 | 1.302 | 1.845 | 1.841 | 1.947 | 2.491 | 10.786 | 0.944 |
| 18 | 777 | 77.70 | 1.383 | 1.905 | 1.874 | 1.979 | 2.397 | 22.821 | 0.987 |
| 19 | 763 | 76.30 | 1.541 | 1.934 | 1.848 | 1.977 | 2.509 | 10.859 | 0.834 |
| 20 | 764 | 76.40 | 1.592 | 1.966 | 1.881 | 1.985 | 2.448 | 22.703 | 1.125 |
| 21 | 773 | 77.30 | 1.578 | 1.961 | 1.846 | 1.973 | 2.521 | 11.301 | 0.985 |
| 22 | 770 | 77.00 | 1.541 | 1.932 | 1.837 | 1.977 | 2.498 | 10.850 | 0.822 |
| 23 | 768 | 76.80 | 1.616 | 1.931 | 1.846 | 1.981 | 2.411 | 10.878 | 0.832 |
| 24 | 771 | 77.10 | 1.567 | 1.973 | 1.833 | 1.976 | 4.673 | 22.840 | 1.144 |
| 25 | 772 | 77.20 | 1.545 | 1.932 | 1.846 | 2.001 | 2.610 | 11.395 | 0.731 |
| 26 | 772 | 77.20 | 1.558 | 1.947 | 1.902 | 1.994 | 2.659 | 11.138 | 0.767 |
| 27 | 767 | 76.70 | 1.540 | 1.939 | 1.868 | 2.028 | 2.512 | 10.837 | 0.767 |
| 28 | 785 | 78.50 | 1.513 | 1.905 | 1.812 | 1.906 | 2.465 | 11.299 | 0.880 |
| 29 | 826 | 82.60 | 1.320 | 1.849 | 1.812 | 1.942 | 2.365 | 10.855 | 0.924 |
| 30 | 770 | 77.00 | 1.552 | 1.910 | 1.862 | 1.967 | 2.475 | 10.973 | 0.701 |
| 31 | 746 | 74.60 | 1.633 | 1.994 | 1.906 | 2.023 | 2.449 | 10.857 | 0.873 |
| 32 | 717 | 71.70 | 1.660 | 2.014 | 1.908 | 2.099 | 4.714 | 10.843 | 0.870 |
Graphs
Response Time: 10 sec time-series
Response Time: raw data (all points)
Throughput: 10 sec time-series
