Performance Results Report
Summary
transactions: 6337
errors: 0
run time: 60 secs
rampup: 60 secs
test start: 2011-08-24 10:55:31
test finish: 2011-08-24 10:56:31
time-series interval: 10 secs
workload configuration:
| group name | threads | script name |
|---|
| user_group-1 | 5 | example_wego2.py |
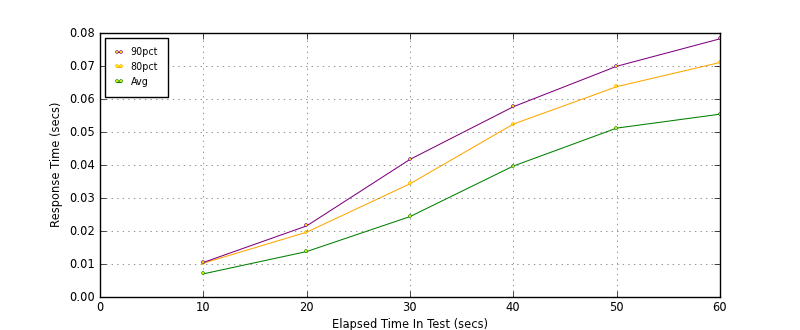
All Transactions
Transaction Response Summary (secs)
| count | min | avg | 80pct | 90pct | 95pct | max | stdev |
|---|
| 6337 | 0.005 | 0.028 | 0.050 | 0.063 | 0.070 | 0.117 | 0.022 |
Interval Details (secs)
| interval | count | rate | min | avg | 80pct | 90pct | 95pct | max | stdev |
|---|
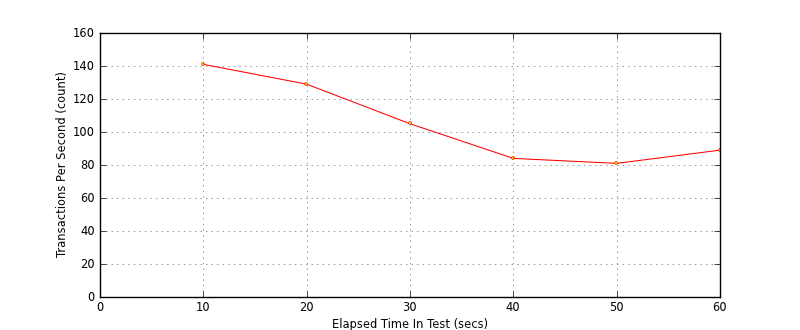
| 1 | 1419 | 141.90 | 0.005 | 0.007 | 0.010 | 0.010 | 0.011 | 0.035 | 0.003 |
| 2 | 1299 | 129.90 | 0.005 | 0.014 | 0.020 | 0.022 | 0.023 | 0.039 | 0.006 |
| 3 | 1058 | 105.80 | 0.005 | 0.024 | 0.034 | 0.042 | 0.048 | 0.066 | 0.012 |
| 4 | 849 | 84.90 | 0.008 | 0.040 | 0.052 | 0.058 | 0.065 | 0.101 | 0.014 |
| 5 | 812 | 81.20 | 0.009 | 0.051 | 0.064 | 0.070 | 0.074 | 0.099 | 0.014 |
| 6 | 895 | 89.50 | 0.009 | 0.055 | 0.071 | 0.078 | 0.085 | 0.117 | 0.021 |
Graphs
Response Time: 10 sec time-series
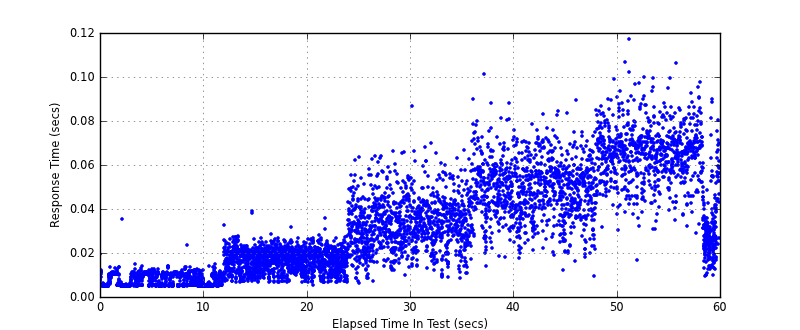
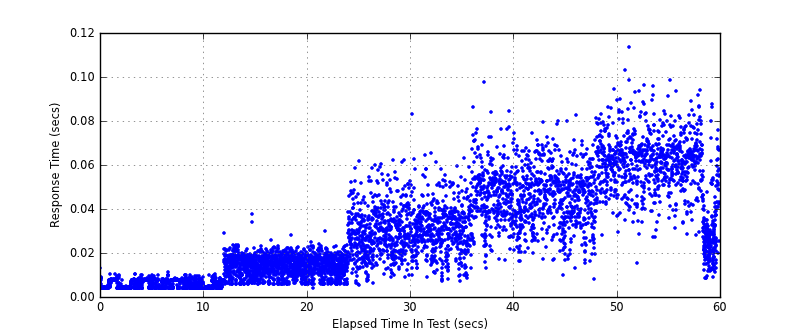
Response Time: raw data (all points)
Throughput: 5 sec time-series
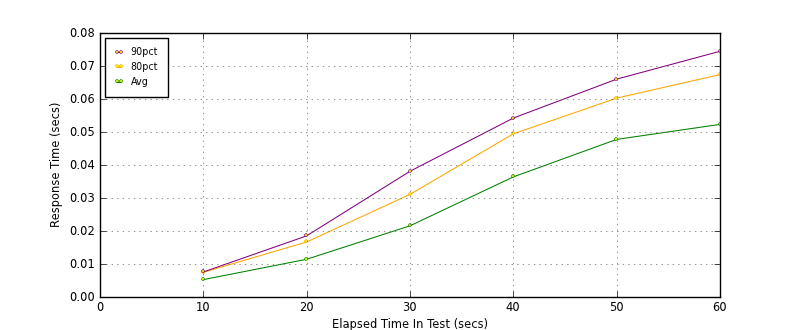
Custom Timer: WEGO MAIN GUI
Timer Summary (secs)
| count | min | avg | 80pct | 90pct | 95pct | max | stdev |
|---|
| 6332 | 0.004 | 0.026 | 0.047 | 0.059 | 0.066 | 0.113 | 0.021 |
Interval Details (secs)
| interval | count | rate | min | avg | 80pct | 90pct | 95pct | max | stdev |
|---|
| 1 | 1419 | 141.90 | 0.004 | 0.005 | 0.007 | 0.008 | 0.008 | 0.013 | 0.002 |
| 2 | 1299 | 129.90 | 0.004 | 0.011 | 0.017 | 0.019 | 0.020 | 0.038 | 0.006 |
| 3 | 1058 | 105.80 | 0.004 | 0.022 | 0.031 | 0.038 | 0.045 | 0.062 | 0.012 |
| 4 | 849 | 84.90 | 0.007 | 0.036 | 0.049 | 0.054 | 0.061 | 0.098 | 0.014 |
| 5 | 812 | 81.20 | 0.008 | 0.048 | 0.060 | 0.066 | 0.071 | 0.094 | 0.014 |
| 6 | 895 | 89.50 | 0.008 | 0.052 | 0.067 | 0.074 | 0.081 | 0.113 | 0.020 |
Graphs
Response Time: 10 sec time-series
Response Time: raw data (all points)
Throughput: 10 sec time-series
