Performance Results Report
Summary
transactions: 784
errors: 0
run time: 60 secs
rampup: 30 secs
test start: 2013-03-05 10:16:05
test finish: 2013-03-05 10:17:05
time-series interval: 5 secs
workload configuration:
| group name | threads | script name |
|---|
| user_group-1 | 25 | example_wego2.py |
All Transactions
Transaction Response Summary (secs)
| count | min | avg | 80pct | 90pct | 95pct | max | stdev |
|---|
| 784 | 0.562 | 1.476 | 1.842 | 1.956 | 2.033 | 2.289 | 0.470 |
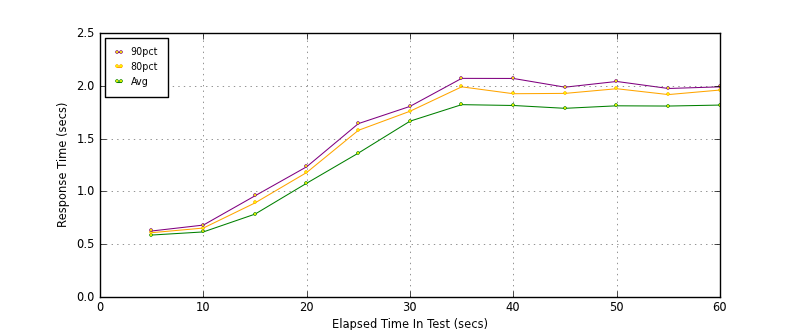
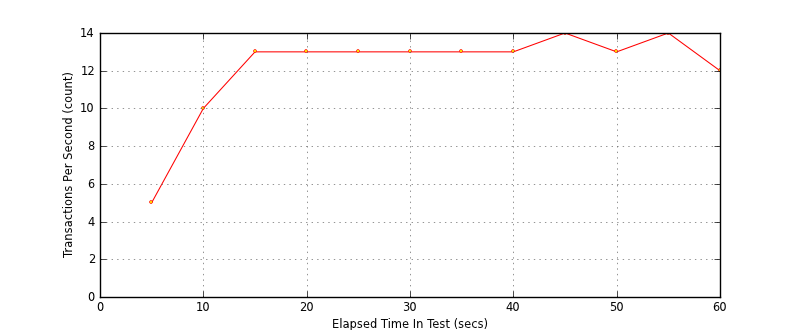
Interval Details (secs)
| interval | count | rate | min | avg | 80pct | 90pct | 95pct | max | stdev |
|---|
| 1 | 25 | 5.00 | 0.562 | 0.587 | 0.609 | 0.625 | 0.634 | 0.635 | 0.022 |
| 2 | 53 | 10.60 | 0.563 | 0.616 | 0.653 | 0.681 | 0.690 | 0.717 | 0.040 |
| 3 | 69 | 13.80 | 0.630 | 0.785 | 0.891 | 0.958 | 1.023 | 1.098 | 0.116 |
| 4 | 66 | 13.20 | 0.687 | 1.077 | 1.179 | 1.233 | 1.270 | 1.459 | 0.143 |
| 5 | 69 | 13.80 | 0.948 | 1.363 | 1.578 | 1.642 | 1.660 | 1.722 | 0.198 |
| 6 | 67 | 13.40 | 1.212 | 1.665 | 1.759 | 1.805 | 1.813 | 2.037 | 0.149 |
| 7 | 68 | 13.60 | 1.555 | 1.821 | 1.990 | 2.070 | 2.118 | 2.262 | 0.170 |
| 8 | 69 | 13.80 | 1.455 | 1.814 | 1.925 | 2.070 | 2.162 | 2.224 | 0.152 |
| 9 | 71 | 14.20 | 0.946 | 1.787 | 1.928 | 1.987 | 2.040 | 2.151 | 0.167 |
| 10 | 69 | 13.80 | 1.519 | 1.811 | 1.972 | 2.041 | 2.089 | 2.203 | 0.148 |
| 11 | 70 | 14.00 | 1.488 | 1.808 | 1.917 | 1.975 | 2.002 | 2.289 | 0.141 |
| 12 | 63 | 12.60 | 1.499 | 1.818 | 1.960 | 1.990 | 2.039 | 2.217 | 0.146 |
Graphs
Response Time: 5 sec time-series
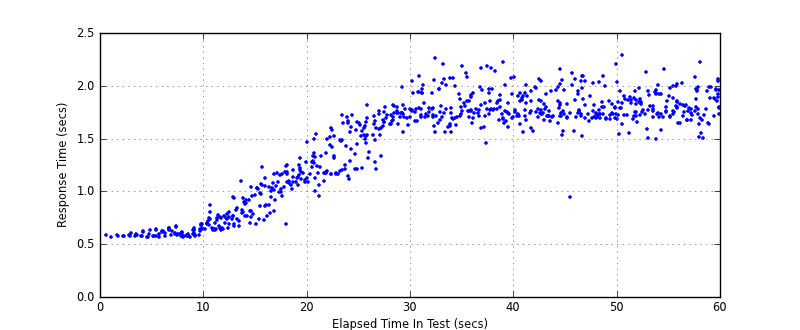
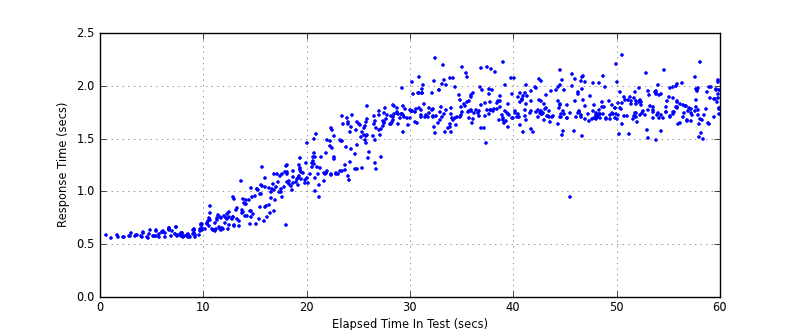
Response Time: raw data (all points)
Throughput: 5 sec time-series
Custom Timer: METEOGRAM_1
Timer Summary (secs)
| count | min | avg | 80pct | 90pct | 95pct | max | stdev |
|---|
| 759 | 0.556 | 1.472 | 1.837 | 1.952 | 2.028 | 2.283 | 0.470 |
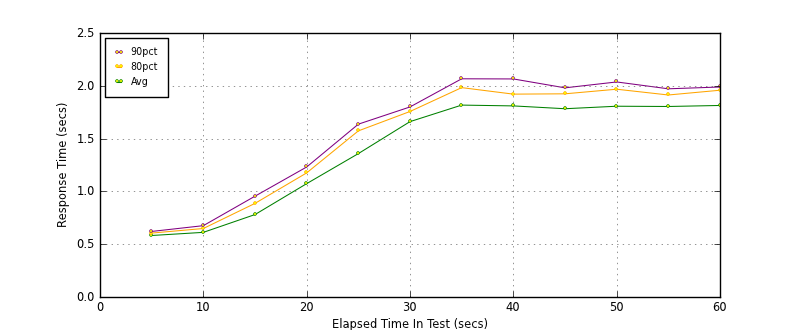
Interval Details (secs)
| interval | count | rate | min | avg | 80pct | 90pct | 95pct | max | stdev |
|---|
| 1 | 25 | 5.00 | 0.556 | 0.582 | 0.605 | 0.621 | 0.630 | 0.630 | 0.022 |
| 2 | 53 | 10.60 | 0.559 | 0.612 | 0.649 | 0.676 | 0.686 | 0.712 | 0.040 |
| 3 | 69 | 13.80 | 0.625 | 0.781 | 0.886 | 0.955 | 1.020 | 1.094 | 0.117 |
| 4 | 66 | 13.20 | 0.682 | 1.073 | 1.175 | 1.231 | 1.264 | 1.457 | 0.144 |
| 5 | 69 | 13.80 | 0.944 | 1.358 | 1.573 | 1.637 | 1.655 | 1.717 | 0.198 |
| 6 | 67 | 13.40 | 1.208 | 1.661 | 1.757 | 1.800 | 1.810 | 2.033 | 0.148 |
| 7 | 68 | 13.60 | 1.551 | 1.817 | 1.983 | 2.066 | 2.113 | 2.258 | 0.170 |
| 8 | 69 | 13.80 | 1.450 | 1.810 | 1.921 | 2.065 | 2.157 | 2.219 | 0.152 |
| 9 | 71 | 14.20 | 0.945 | 1.783 | 1.924 | 1.981 | 2.036 | 2.141 | 0.166 |
| 10 | 69 | 13.80 | 1.517 | 1.807 | 1.968 | 2.036 | 2.084 | 2.199 | 0.148 |
| 11 | 70 | 14.00 | 1.483 | 1.804 | 1.913 | 1.972 | 1.998 | 2.283 | 0.141 |
| 12 | 63 | 12.60 | 1.495 | 1.814 | 1.958 | 1.989 | 2.034 | 2.216 | 0.145 |
Graphs
Response Time: 5 sec time-series
Response Time: raw data (all points)
Throughput: 5 sec time-series
