Performance Results Report
Summary
transactions: 133
errors: 0
run time: 60 secs
rampup: 30 secs
test start: 2013-03-05 10:19:50
test finish: 2013-03-05 10:20:45
time-series interval: 5 secs
workload configuration:
| group name | threads | script name |
|---|
| user_group-1 | 25 | example_wego2.py |
All Transactions
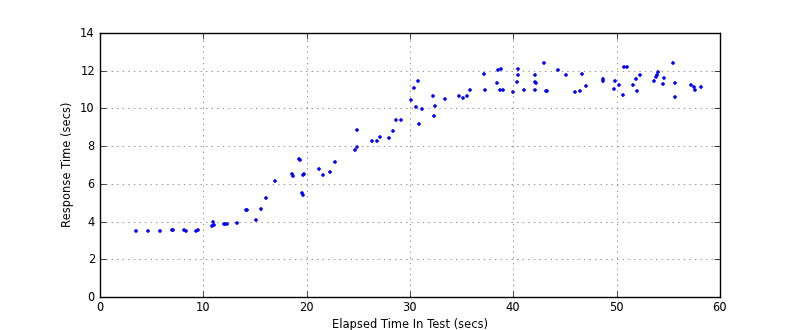
Transaction Response Summary (secs)
| count | min | avg | 80pct | 90pct | 95pct | max | stdev |
|---|
| 133 | 3.460 | 8.955 | 11.440 | 11.783 | 12.064 | 12.397 | 3.022 |
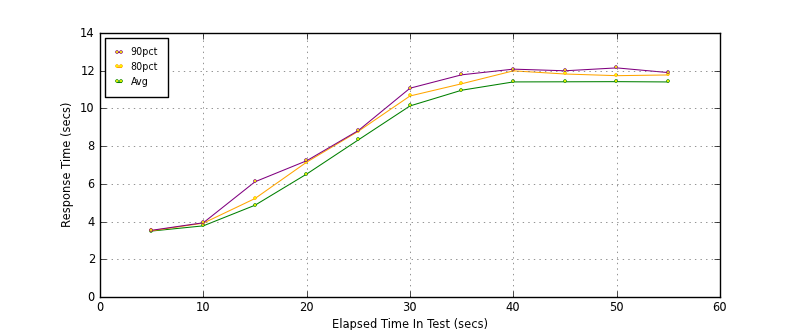
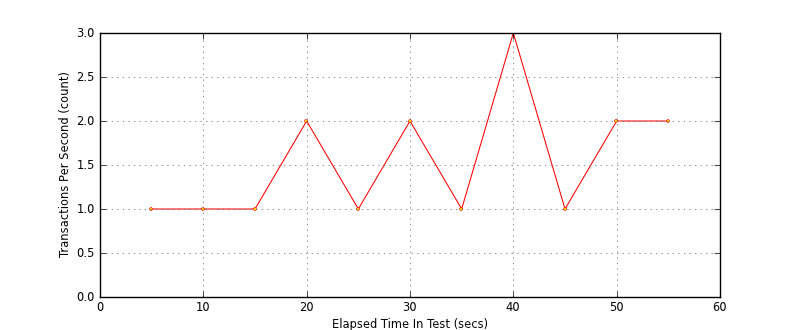
Interval Details (secs)
| interval | count | rate | min | avg | 80pct | 90pct | 95pct | max | stdev |
|---|
| 1 | 7 | 1.40 | 3.460 | 3.498 | 3.516 | 3.538 | 3.538 | 3.538 | 0.029 |
| 2 | 9 | 1.80 | 3.473 | 3.773 | 3.916 | 3.938 | 3.938 | 3.938 | 0.170 |
| 3 | 6 | 1.20 | 4.085 | 4.868 | 5.223 | 6.111 | 6.111 | 6.111 | 0.708 |
| 4 | 12 | 2.40 | 5.404 | 6.521 | 7.152 | 7.226 | 7.304 | 7.304 | 0.594 |
| 5 | 8 | 1.60 | 7.759 | 8.332 | 8.789 | 8.827 | 8.827 | 8.827 | 0.372 |
| 6 | 12 | 2.40 | 9.138 | 10.133 | 10.660 | 11.073 | 11.440 | 11.440 | 0.711 |
| 7 | 7 | 1.40 | 10.536 | 10.966 | 11.308 | 11.783 | 11.783 | 11.783 | 0.446 |
| 8 | 16 | 3.20 | 10.843 | 11.406 | 11.992 | 12.084 | 12.397 | 12.397 | 0.523 |
| 9 | 6 | 1.20 | 10.833 | 11.412 | 11.826 | 11.996 | 11.996 | 11.996 | 0.501 |
| 10 | 12 | 2.40 | 10.696 | 11.420 | 11.737 | 12.150 | 12.181 | 12.181 | 0.458 |
| 11 | 13 | 2.60 | 10.565 | 11.405 | 11.775 | 11.901 | 12.374 | 12.374 | 0.462 |
Graphs
Response Time: 5 sec time-series
Response Time: raw data (all points)

Throughput: 5 sec time-series
Custom Timer: METEOGRAM_1
Timer Summary (secs)
| count | min | avg | 80pct | 90pct | 95pct | max | stdev |
|---|
| 108 | 3.456 | 8.951 | 11.436 | 11.779 | 12.058 | 12.393 | 3.022 |
Interval Details (secs)
| interval | count | rate | min | avg | 80pct | 90pct | 95pct | max | stdev |
|---|
| 1 | 7 | 1.40 | 3.456 | 3.494 | 3.512 | 3.534 | 3.534 | 3.534 | 0.029 |
| 2 | 9 | 1.80 | 3.469 | 3.769 | 3.912 | 3.934 | 3.934 | 3.934 | 0.170 |
| 3 | 6 | 1.20 | 4.080 | 4.863 | 5.218 | 6.106 | 6.106 | 6.106 | 0.708 |
| 4 | 12 | 2.40 | 5.400 | 6.517 | 7.147 | 7.222 | 7.302 | 7.302 | 0.594 |
| 5 | 8 | 1.60 | 7.755 | 8.328 | 8.784 | 8.823 | 8.823 | 8.823 | 0.372 |
| 6 | 12 | 2.40 | 9.134 | 10.129 | 10.656 | 11.069 | 11.436 | 11.436 | 0.711 |
| 7 | 7 | 1.40 | 10.530 | 10.961 | 11.303 | 11.779 | 11.779 | 11.779 | 0.446 |
| 8 | 16 | 3.20 | 10.839 | 11.402 | 11.990 | 12.078 | 12.393 | 12.393 | 0.523 |
| 9 | 6 | 1.20 | 10.831 | 11.409 | 11.822 | 11.992 | 11.992 | 11.992 | 0.500 |
| 10 | 12 | 2.40 | 10.692 | 11.416 | 11.734 | 12.147 | 12.177 | 12.177 | 0.458 |
| 11 | 13 | 2.60 | 10.563 | 11.401 | 11.772 | 11.897 | 12.370 | 12.370 | 0.461 |
Graphs
Response Time: 5 sec time-series

Response Time: raw data (all points)
Throughput: 5 sec time-series
